
Problem: There is a vast amount of data regarding the U.S. population, housing and economic information available to businesses today. The majority of these data are free and publicly available through the U.S Census Bureau's American Fact Finder (AFF) website. Spatial GIS census data is also available through the Topologically Integrated Geographic Encoding and Referencing System (TIGER). This information can be used to research and analyze a given population in a state, county, or other census tract. Using this information to understand the population demographics of a workforce, customer base, education levels in a given area helps businesses make decisions on where and how to operate.

As an example, Southern Arizona has a diverse and growing population. Just south of Phoenix is an area that is rapidly developing. In order to service the growing retirement community and urban sprawl in this area, an assessment of the overall current workforce is needed to assess whether there is enough labor to support the growing workforce needs in the area.
Analysis Procedures: In order to assess the workforce of Southern Arizona Census data sourced from the U.S. Census Bureau, 2011-2015 American Community Survey 5-Year Estimates that includes that includes “Sex by Class of Worker for the Civilian Employed Population 16 Years and Over” was used to assess populations in areas south of Phoenix. This Census data includes the total number of workers broken down to a variety of different worker type categories in block groups across counties in the U.S. One sample of an area analyzed is the Gila River Indian Community which is about 28 miles south of Phoenix down Interstate 10. In this area the total number of male and female workers 16 years and older across block groups in Gila County during 2015 was used to assess the overall workforce in Gila County. Data files obtained from the U.S. Census Bureau AFF and TIGER sites were obtained for the analysis.
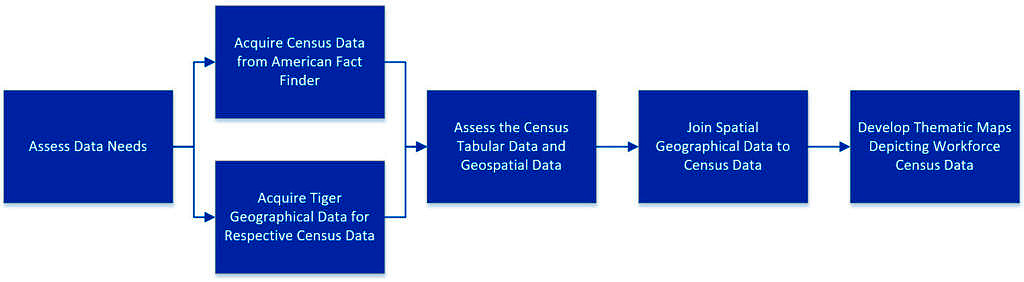
The appropriate data sets were acquired from the U.S. Census Bureau information resources using American Fact Finder for census data. Census data was reviewed for appropriateness related to assessing the workforce in Gila County, AZ. Once the appropriate Census data was acquired, the corresponding U.S. Census Tiger Lines and Shape files were also obtained as geographic shape files used to display Census data.
After the appropriate data sets were acquired, metadata was reviewed and files assessed for data types and domain values using Microsoft Excel and ArcMap 10.4.1. Modifications to the tabular Census data or spatial attribute data was made in order to have a successful primary key to foreign key join between the geographical and tabular Census data files. Once the join was successful and the data were projected in the appropriate State Plane coordinate system, thematic maps depicting various attributes of the workforce in Gila County, AZ were prepared and output for presentation.
Results:
![]()
Application & Reflection: The ability to search and acquire Census data is very useful in finding demographic data to understand a workforce in a given geographic area. This type of information can also be used to understand the demographics of a potential product or service market. By having these demographics geographically displayed can allow decision makers to identify the best areas for distribution centers, stores, or the amount of medical supplies such as vaccines needed to distribute.
Problem description: An emergency preparedness agency is assessing populations around nuclear energy facilities. This information will allow for the appropriate response planning activities needed in the event of an emergency, including evacuation route planning and the development of simulated emergency event model. The information can also be displayed to view potential siting areas for new nuclear energy facilities furthest away from large populations.
Data needed: The energy company has current maps displaying the locations of existing nuclear energy facilities. Additional U.S. Census Population data are obtained from the American Fact Finder website that include population demographics for all counties within 100 miles of each nuclear energy facility. Additionally TIGER GIS shape files are obtained for mapping the information by county and road layers from the U.S. Department of Transportation for evacuation route planning.
Analysis procedures: After obtaining the various data, the data types are reviewed for consistency and key fields are identified for joining the data spatially to the nuclear energy facilities. Thematic maps are produced to display the populations in counties around each facility and roads are displayed to identify evacuation routes. Depending on the county distance and direction from the nuclear energy facility evacuation routes and timing of evacuation are determined in the north, south, east, and west directions.