
Problem: Finding suitable sites that are the most optimal for a school, medical facilities, tourist attraction, or shopping mall depends on various factors related to demographics, the community, and business conditions. Prioritizing, weighting, and overlaying these factors to identify spatial areas that meet the majority of the most important factors is considered a suitability analysis: identifying the most suitable areas or locations based on a certain set of criteria.
In this example a bear habitat suitability analysis was performed for the Great Smokey Mountains National Park in order to identify areas that are optimal for wild bear habitat. Wild bears will be relocated to the optimal habitat areas when they are found in tourist areas so they stay in the bear habitat areas and don't return to tourist areas. Interactions with bears is dangerous and can be fatal and this initiative within the Great Smokey Mountains National Park identifies the greatest suitable bear habitats, so bears can be relocated there, stay there, and thus reduce the potential for bears to interact with park visitors.
The Great Smokey Mountain National Park biologists have done their research to identify the best habitats for bears. The most suitable habitat for wild bears are away from roads and hiking trails, near streams and populated with grape thicket vegetation or other hardwoods as a second favorite, and surface areas that are relatively flat with less than 30 degrees of slope. This information has been provided in the various GIS formats projected in the Universal Transverse Mercator coordinate system, North American Datum of 1972, Zone 17 in meter units.
Analysis Procedures: Our strategy for performing a bear habitat suitability analysis is to examine the research data layers provided by the biologists at the Great Smoky Mountains National Park. A ranking criterial will be used in the analysis for each bear habitat factor within ArcGIS 10.4.1. Files will be converted to raster using tools based on their original file format. Raster image layers are then reclassified to identify 30 meter cells that meet "Most Favorable", "Favorable", and "Least Favorable" conditions and then all of the reclassified layers are combined with the Weighted Overlay tool to find those areas meeting the majority of the suitability criteria for the best bear habitat.
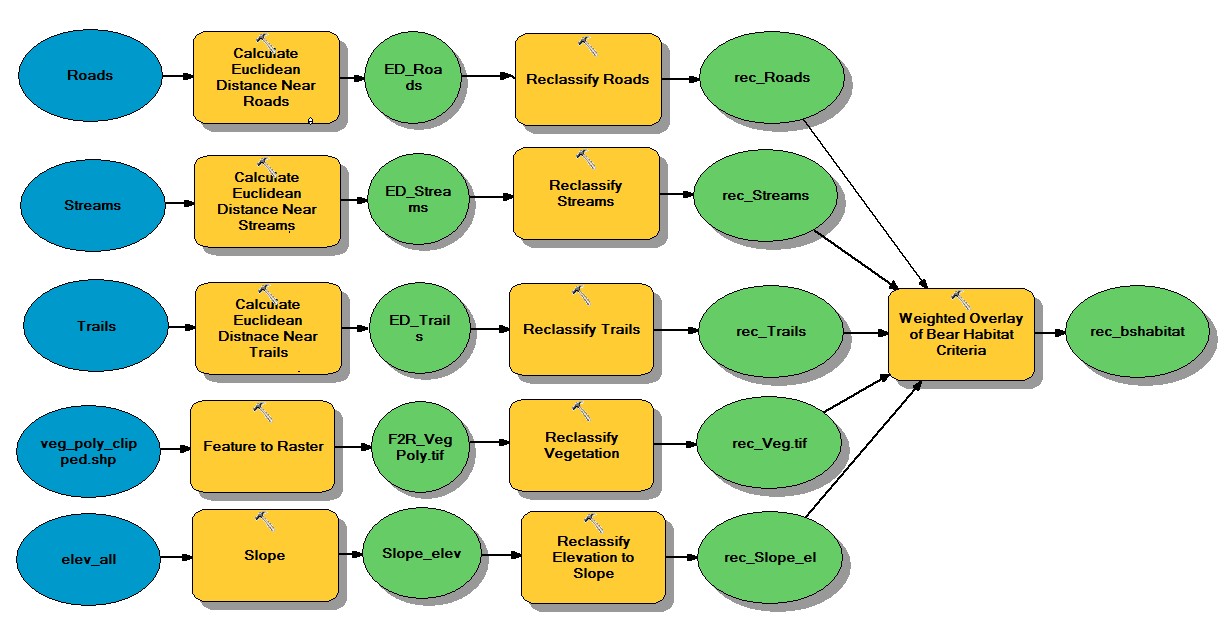
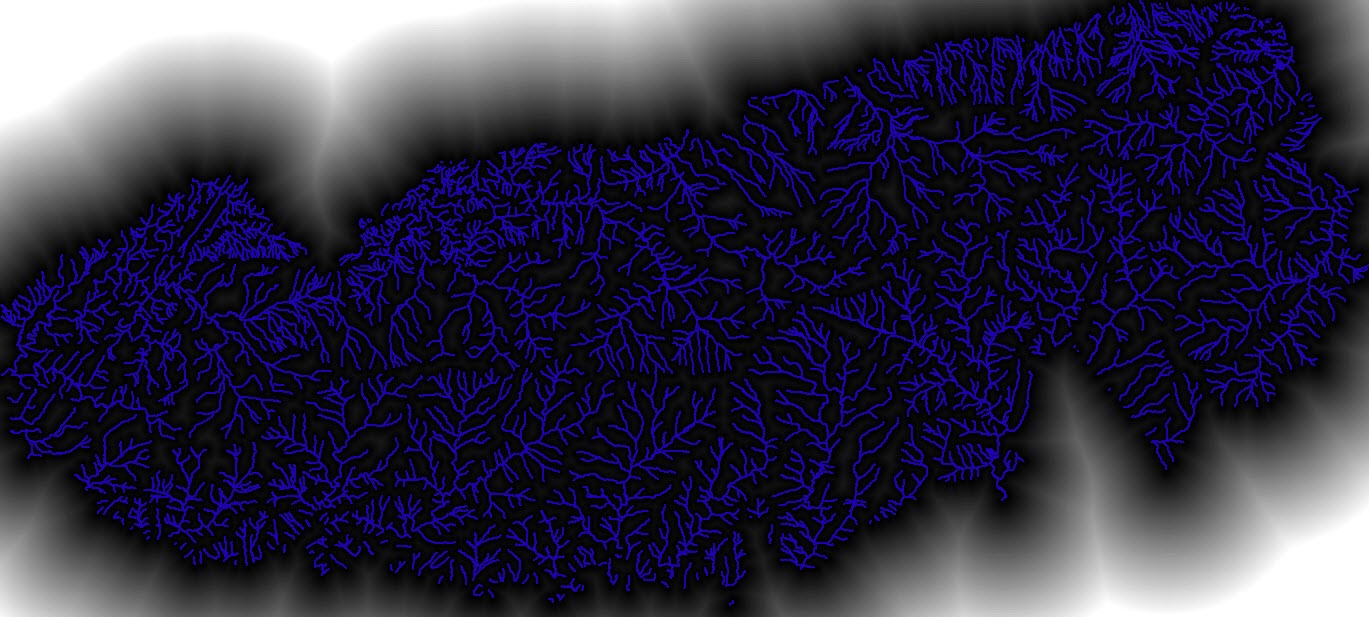
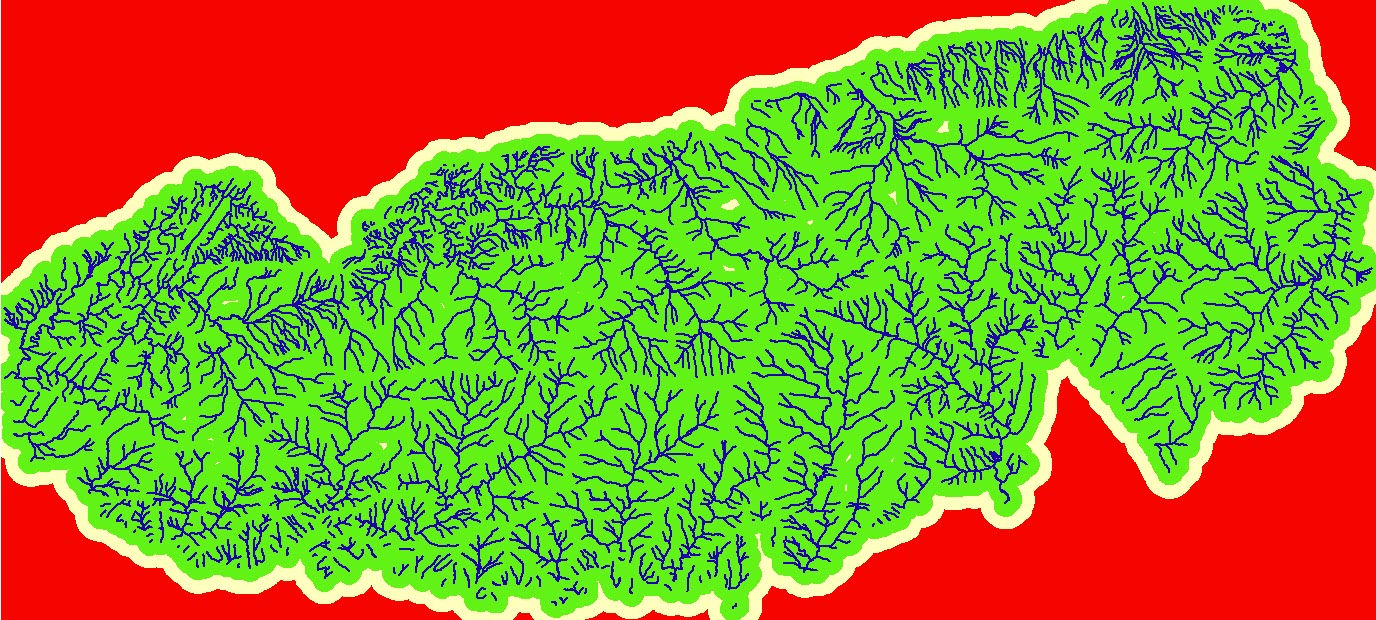
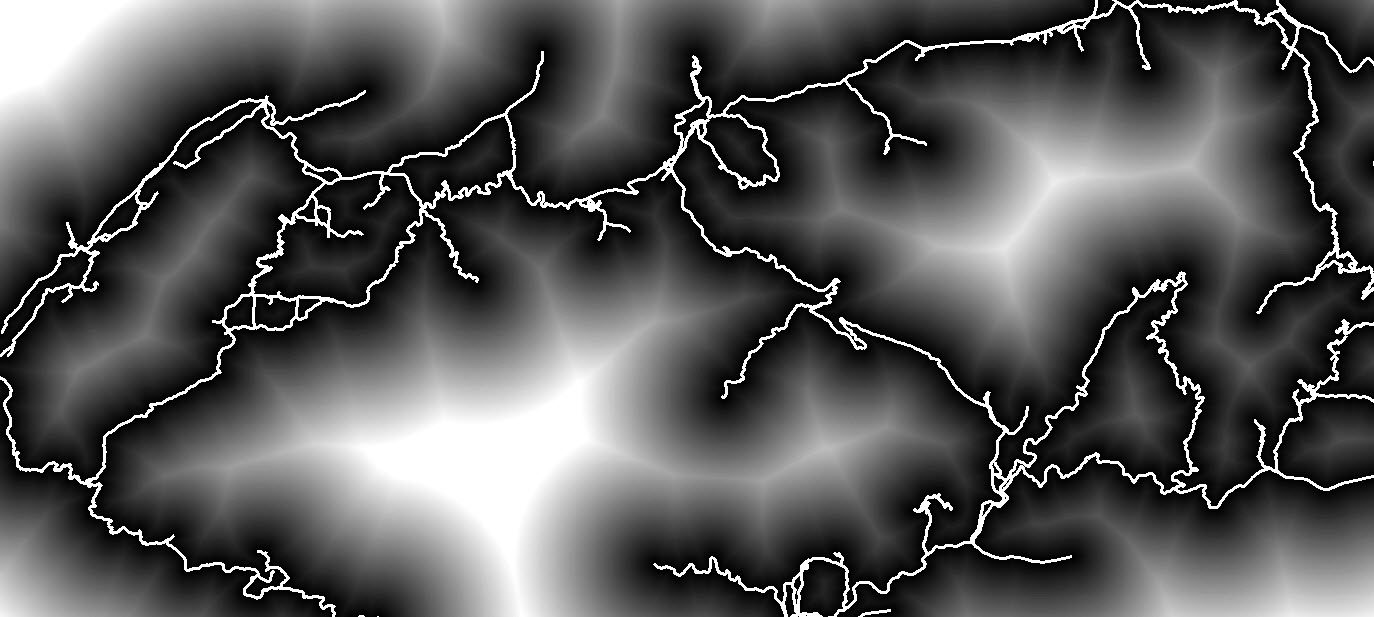
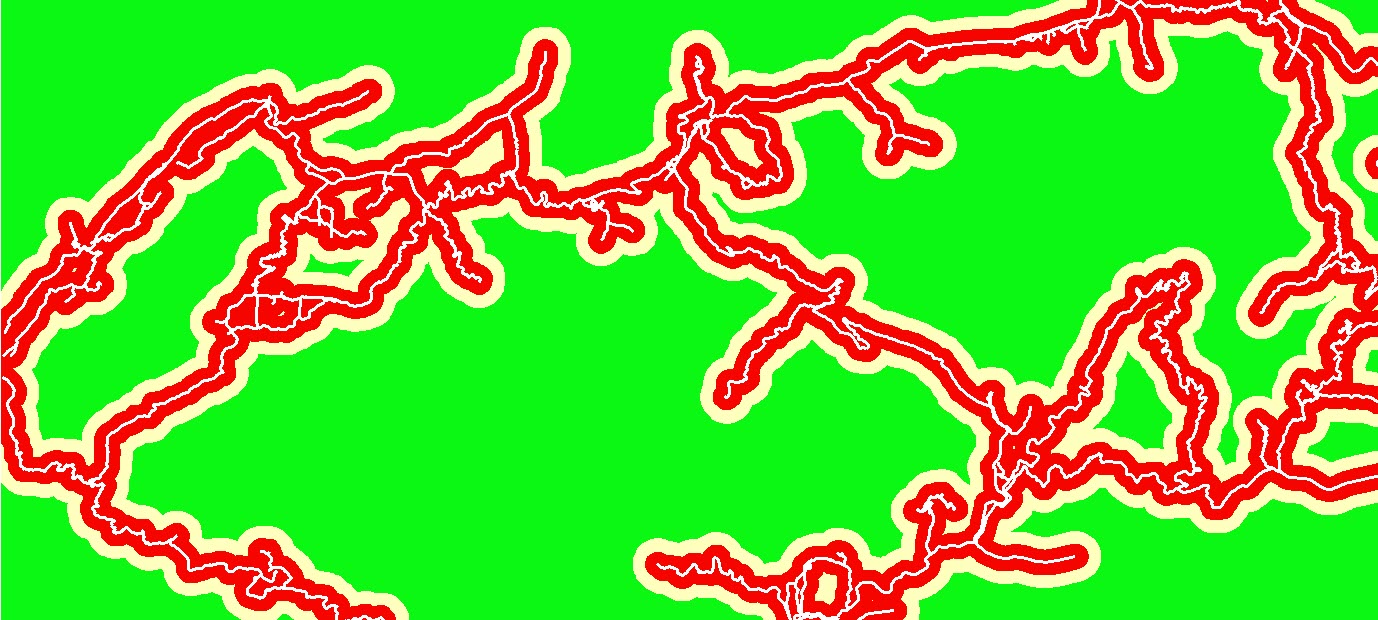
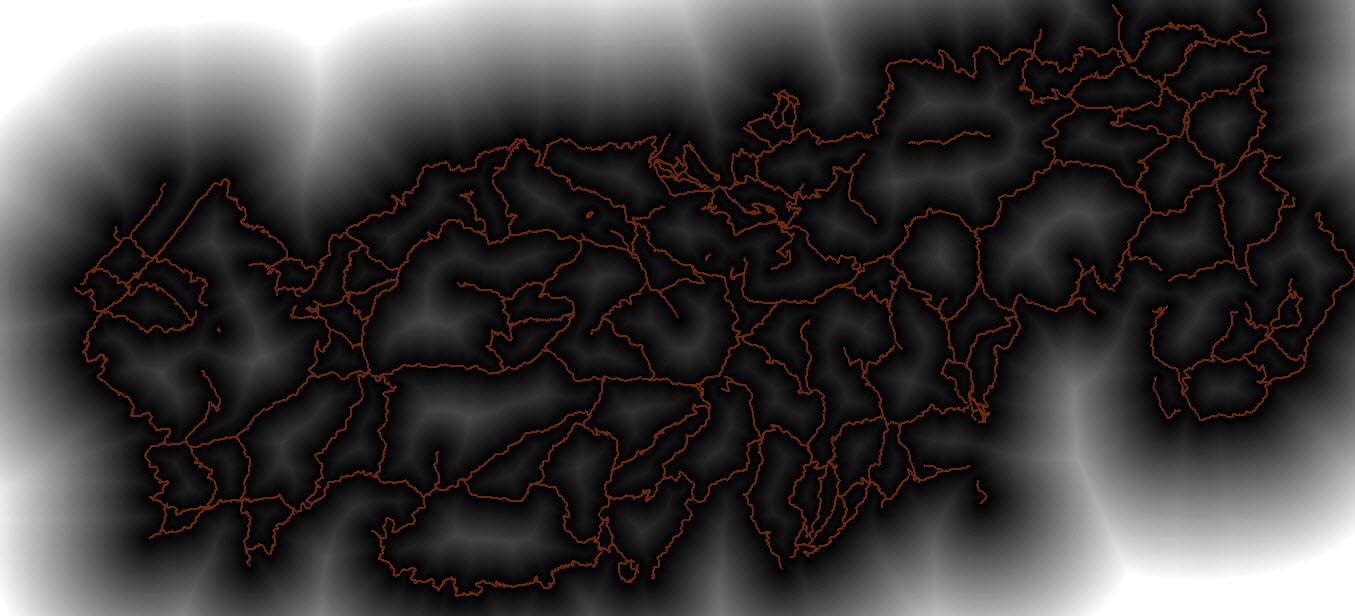
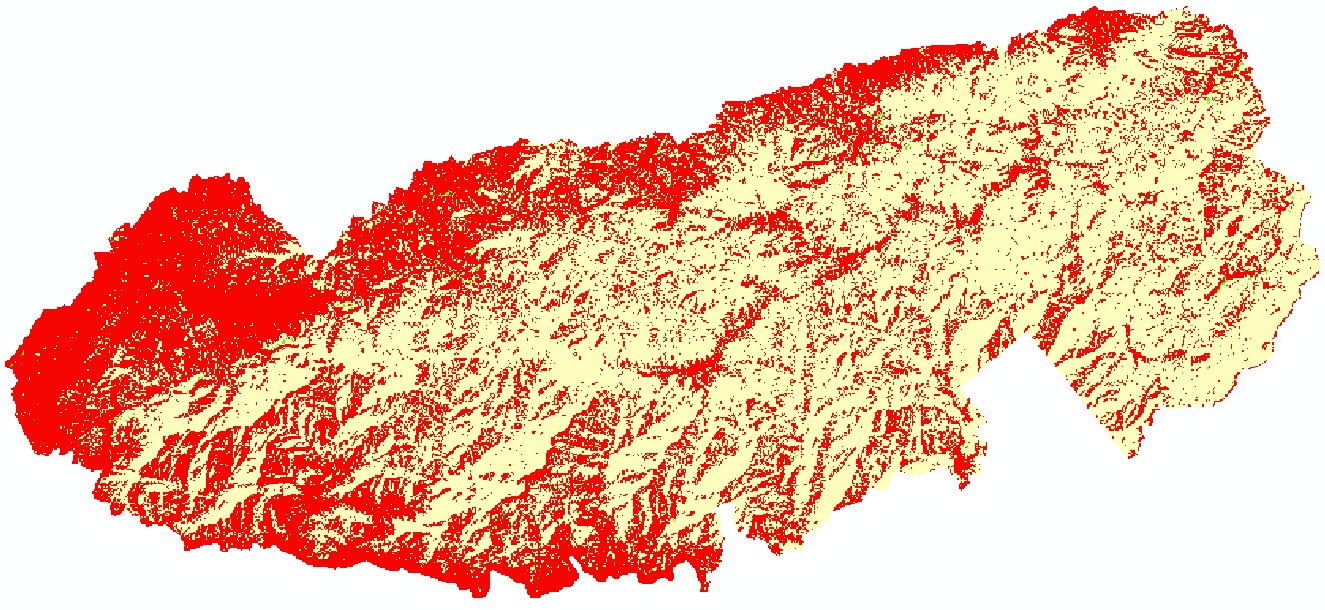
The ArcGIS 10.4.1 Spatial Analyst Euclidean Distance tool is used to convert vector data files for streams, roadways, and trails to raster tagged image files (.TIFs). Each raster file generated will have a 30 meter cell size for resolution which will allow the Euclidean Distance tool to create cells a size of 30 meters and assign a bear habitat value based on the distance to roads, trails, or streams. Since our criteria for suitable habitat is based on miles when using the ArcGIS 10.4.1 Spatial Analyst Reclassify tool we will use threshold distances of 804.672 meters for half mile and 1609.344 meters for full mile. The Reclassify tool will allow us to assign categories to each 30 meter cell for “Least Favorable”, “Favorable”, and “Most Favorable” based on their distance from roads and trails and proximity to streams.
The ArcGIS Feature to Raster tool was used for converting the vegetation polygon vector file to a raster file with each 30 meter cell assigned a value to represent the dominant vegetation present in that cell. The ArcGIS Spatial Analyst Reclassify tool was used again to convert values for “Grape Thicket” vegetation to 3 – “Most Favorable”, for Northern Hardwood, Cove Hardwood, and Mixed Mesic Hardwood to 2 – “Favorable”, and all other categories 1 – “Least Favorable.
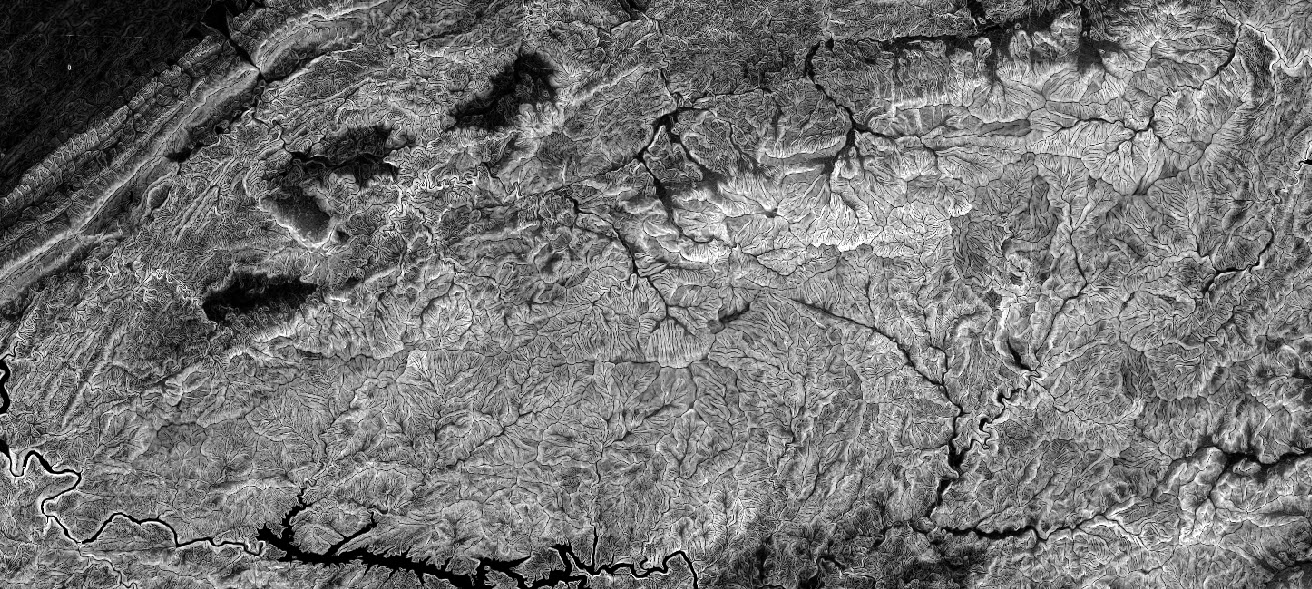
The final criteria factor analyzed for the most suitable bear habitat was based on slope using an elevation raster file. The Slope tool was first used to measure the percent rise of slope and assign each 30 meter cell a slope value. The Reclassify tool was used to reclassify slope into standard categories of “Least Favorable” in areas with a slope of greater than 60 degrees, “Favorable” when slopes are 30-60 degrees and “Most Favorable” for slopes of 0 – 30 degrees.
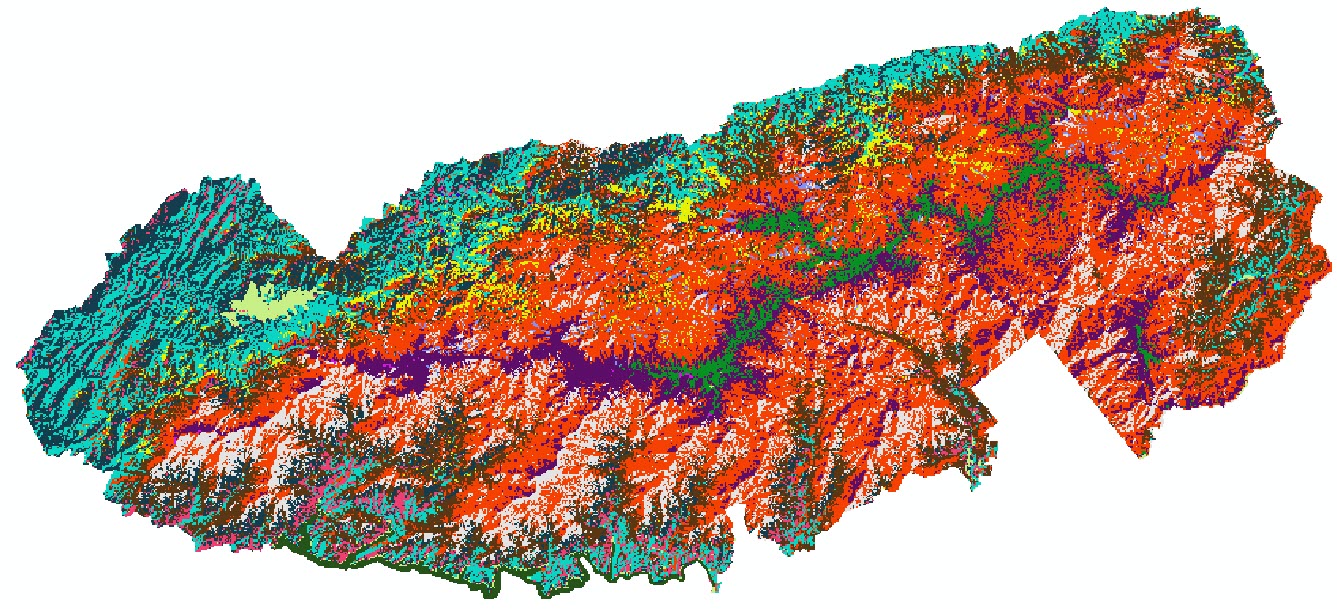
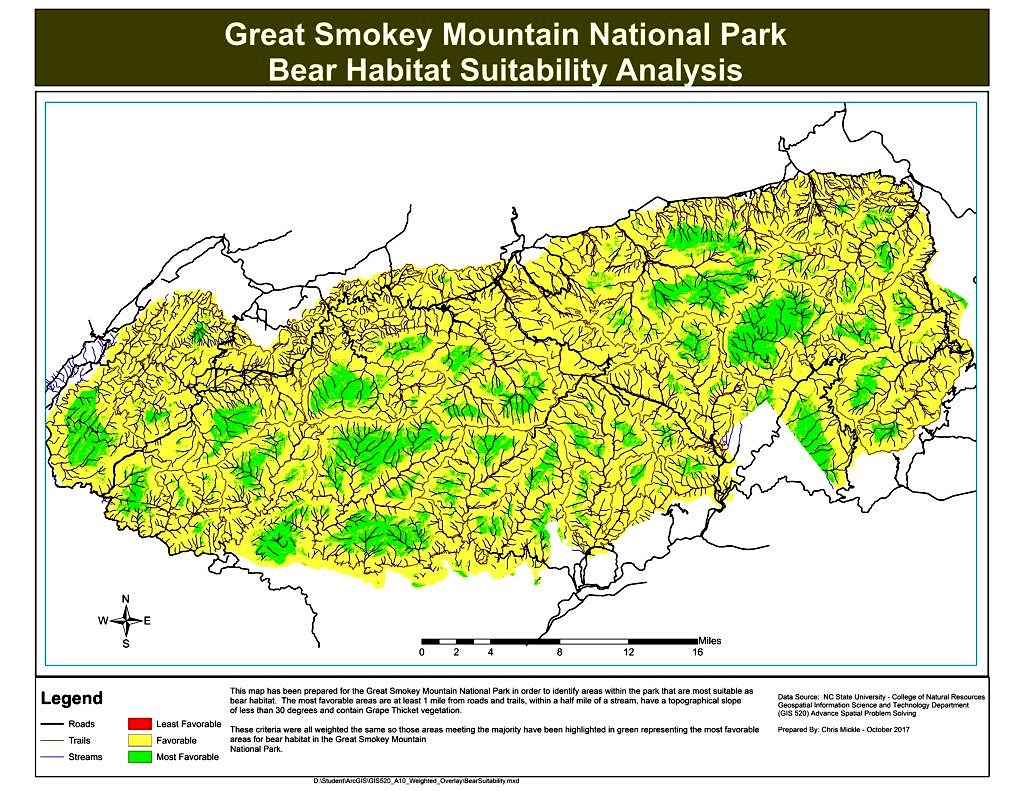
Results: Once all of the criteria factors for bear habitat were reclassified into common categories the ArcGIS 10.4.1 Spatial Analyst Weighted Overlay tool was used to analyze all 5 criteria files and produce a single raster output indicating the most suitable areas for bear habitat. For this analysis all 5 evaluation criteria were weighted equal. Those areas meeting 3 out of 5 or 4 out of 5 criteria were identified as the most suitable. Criteria such as vegetation which had very little areas where Grape Thicket was found did not influence the results.
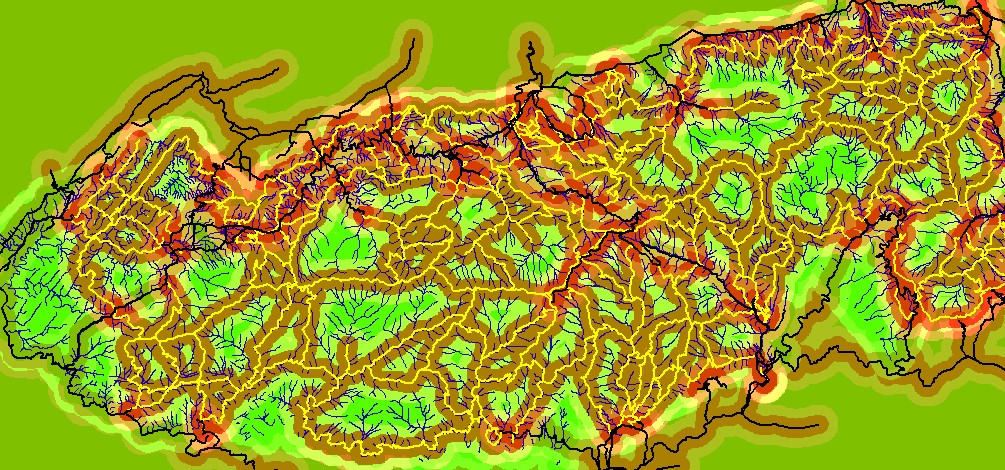
Integrating all of the bear habitat data was completed to produce a final map displaying the suitability analysis results showing the most suitable areas for bears to be relocated to in the Great Smokey Mountains National Park. This map is shown below with the most suitable bear habitat areas shown in green.
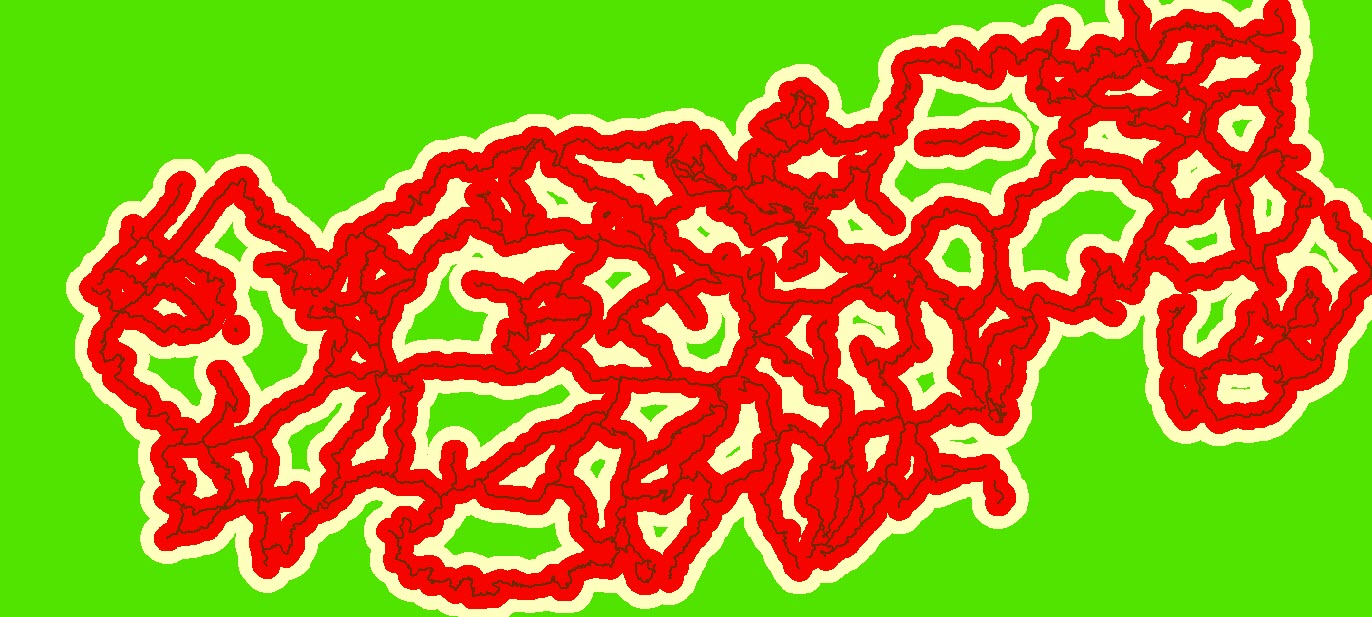
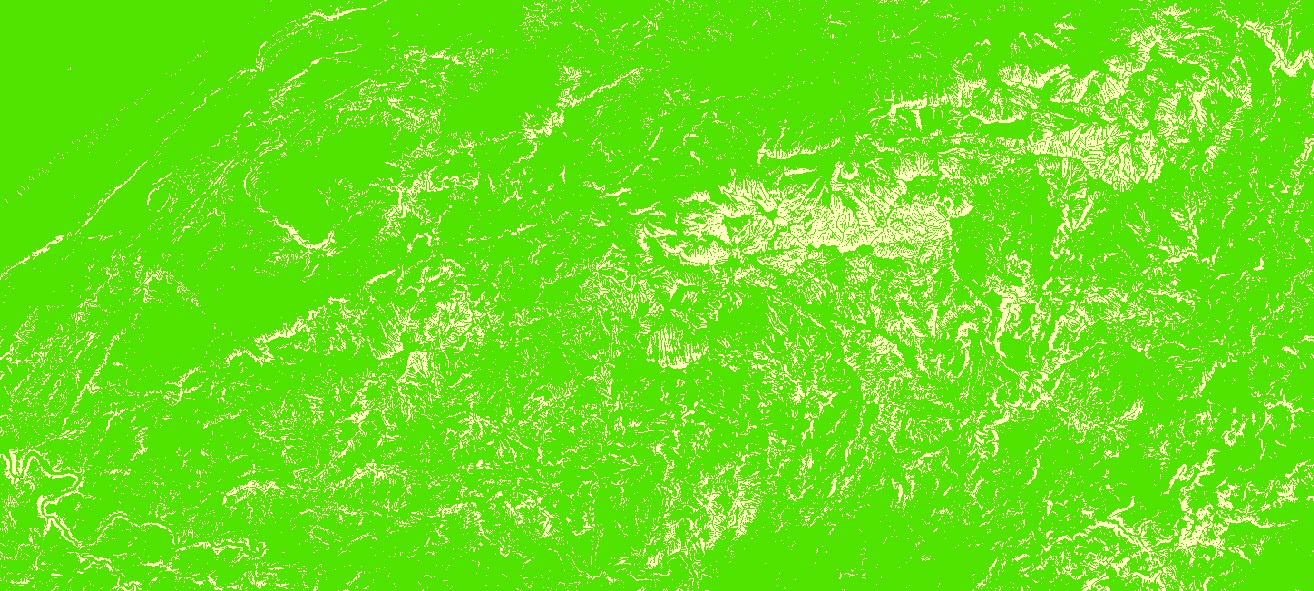
During the process of creating the various reclassified layers for roads, trails, and streams , these layers were overlaid with various levels of transparancy applied so the green color representing the "Most Favorable" areas for bear habitat could be observed. The results of this bears a strong resemblance to our final result using the Weighted Overlay, however using the Weighted Overlay tool takes much less effort.
Application and Reflection: The process of overlaying images to identify overlapping areas has been around for a long time since light tables, acetone sheets, and mylar were first used by designers, drafters, and cartographers. Using this process for converting vector layers to Raster and classifying cells within the raster based on your selection criteria, then setting multiple raster’s to use a common criteria and using the overlay tool to combine and find which areas meet the highest percent of all of the established criteria, or come close to meeting the most criteria is a very valuable tool which leverages the computing power of ArcGIS 10.4.1 Spatial Analyst. In my work as an environmental data manger, I can use similar techniques for combining soil conditions and geologic formations with concentration data that provide us an understanding for areas of a site that have the most threat to groundwater drinking supplies, based on the types of soil, proximity to the groundwater table, and presence of contaminants in the soil, soil vapor, or existing groundwater samples.