
Problem: Maps with accurate point locations representing customer homes, families with students, or retail businesses, are helpful to businesses locating their customers, schools understanding their local student population, or customers finding a store to shop at. Some organizations may not have access to their own parcel maps identifying the locations of customers, students, and merchants but they do have lists with addresses. Geocoding these addresses to individual point locations to understand customer, student, or store locations, or aggregate demographics by zip code can be done with esri ArcGIS.
In this example a particular company sought an analysis to determine where existing customers are located in order to inform the marketing department where to target future marketing campaigns in order to reach unrepresented areas of Wake County and also maintain existing customers.
Data for this analysis includes a spreadsheet with customer addresses from the company requesting the analysis. Data also included a Wake County 2010 boundary shape file layer, Wake County 2017 Zip Codes shape file layer and Wake County 2017 Street Addresses shape file layer all in NC State Plane, Zone 3200; NAD 83; Units: Feet from Wake County GIS agency.
Analysis Procedure: Analyzing existing customers in Wake County starts with a list of customers that have visited the business, or made an online purchase from the business over the past month. This list includes the customer address, when provided. The customer list is valuable business intelligence that was geo-referenced to a map to analyze customer information spatially. The customer data was first examined spatially by zip code to understand demographics and then by address to visualize any grouping or clustering of existing customers. This also reveals areas with the least amount of customers to research the reason and also establish potential new marketing campaigns in these areas. The process for completing the geocoding anlysis as follows.
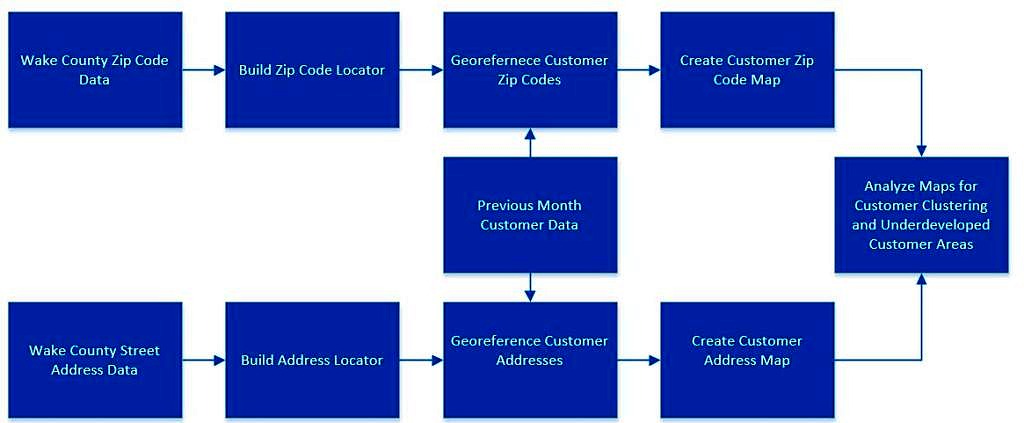
esri ArcMap 10.4.1 and the Address Locator Geocoding tool was was used to build the Zip Code Locator tool to geocode customer addresses to Wake County zip codes. Next the Address Locator Geocoding tool was also used to build the Address Locator tool for Wake County streets. Both tools were used to identify which zip codes had at least one customer and identify where individual customer addresses are located. Maps in the results section below were created to examine if there are any clustering of customer residences and identify areas with the least amount of existing customers. During the process of georeferencing the customer addresses, an additional field was added to combine the street number and street name in the customer data as this is how the addresses are represented in the Wake County 2017 streets data. Additional review and research was done to correct any unmatched addresses due to missing street names, zip codes or building numbers.
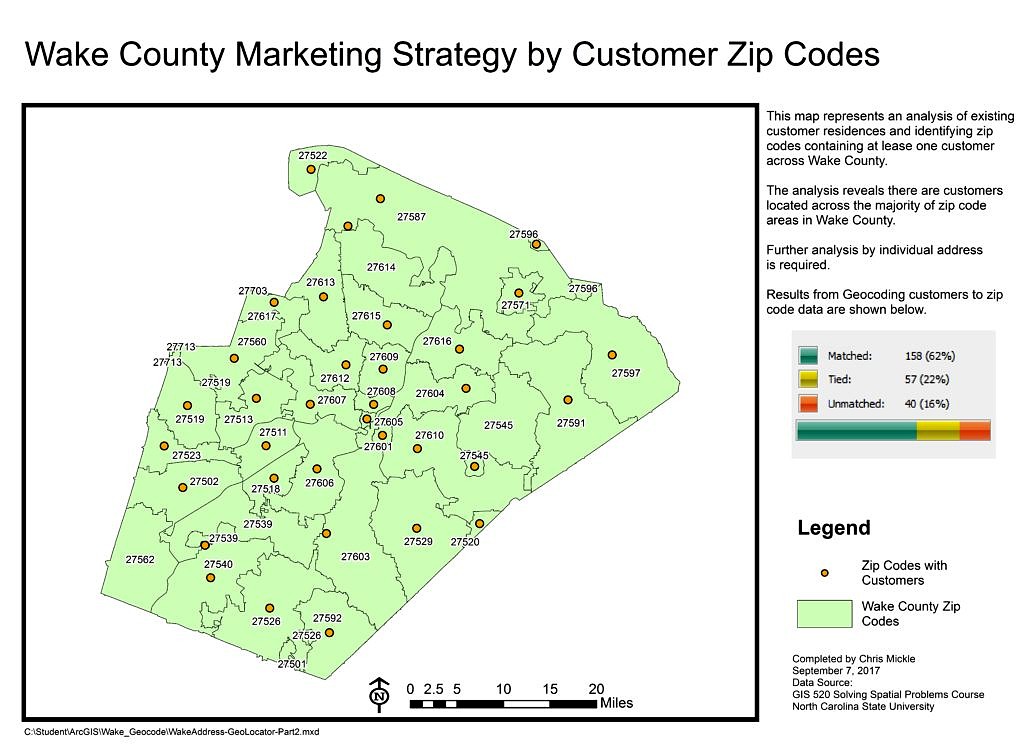
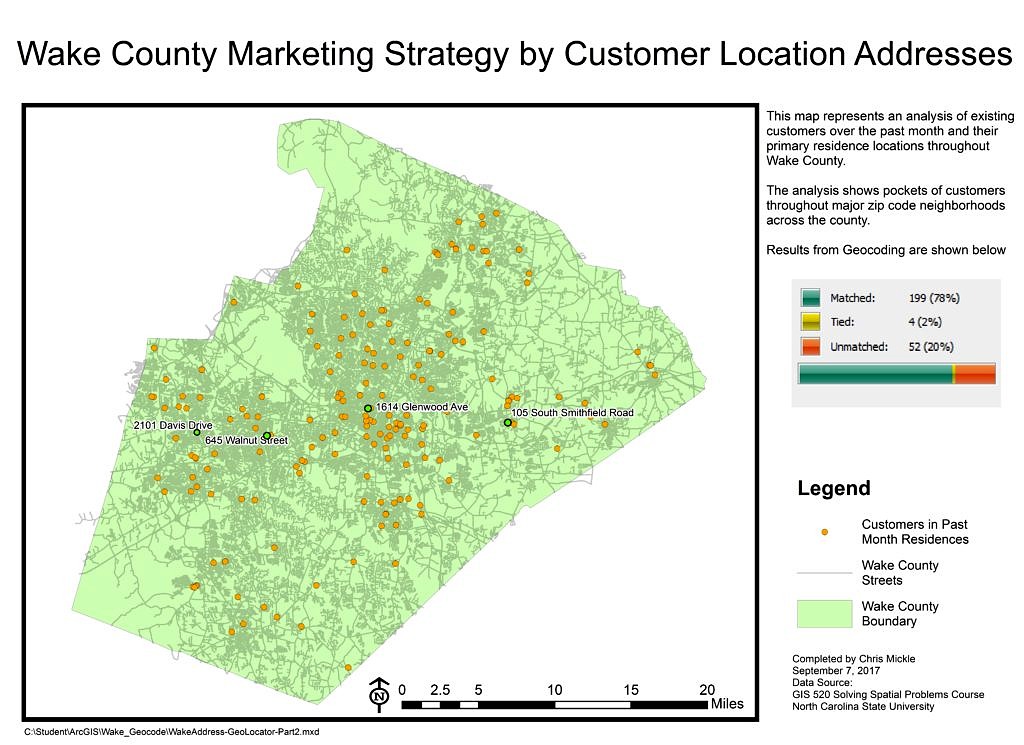
Results: A map was produced to show those zip codes where at least one customer resided. This map showed that the majority of zip codes in Wake County had at least one customer and it was determined that further refinement at the customer address level would be needed.
Application & Reflection: Geocoding addresses to create spatial references is a very useful tool. The outcome of this analysis provided an immediate outcome whereby the esri ArcGIS Address Locator Geocoding tool automates much of the work. Using the Address Locator Geocoding tool is also very applicable for use with environmental data management projects.
- Problem description: Water quality samples are often taken from resident tap water sources or residential groundwater wells and submitted to regulatory agencies for laboratory analysis with an address included for the sample collection location but without a survey and GPS coordinates. Similarly soil vapor intrusion air samples collected in buildings and resident basements, crawlspace, or sub-slab are also often accompanied by an address.
- Data needed: A database with the analytical results of the water quality and soil vapor samples from the laboratory and the list of sampling locations that include addresses. Also needed are shape files from the local state GIS department that includes zip code boundary or individual geo referenced addresses.
- Analysis procedures: Using the esri Address Locator Geocoding tool to match the addresses where water quality and soil vapor samples were collected to georefernced addresses. This will assign an individual point to the location where many water quality and soil vapor samples can be collected over time. These samples will have a lot of information depending on the various laboratory analysis conducted on each media.
Organizations managing this environmental information will want to examine the results of the sample analysis on a map in order to identify any potential contamination areas. Maps can be created to display sample results for certain chemicals at address locations that have results above the regulatory limit for a given chemical. Visualizing these results on a map will determine potential contamination areas. Spatial analysis tools such as kriging, natural neighbor, nearest neighbor, or inverse distance weight can be used to interpolate between sampling points to calculate potential analytical result values for areas where samples lack. Once initial locations are identified with potential contamination additional samples can be collected on those sites with GPS surveyed coordinates to refine the map with known contamination concentrations and sampling locations to visualize a more precise potential plume.