
Problem: Often data come in various formats from different sources even within a single organization. In order to most effectively analyze these data they need to be brought together in a singe database, geo-database, or data set. Data Cardinality refers to the uniqueness of data values in a database and how data objects from multiple tables relate and can be joined. Primary keys create unique records on data tables and foreign keys relate data from one table to another table within a database. The joins can be one to one, one to many, many to one, and many to many. When joining data in esri ArcGIS data can be joined spatially by their distance to nearby feature classes, or by attributes when the associated data objects have a key field with matching values on both tables.
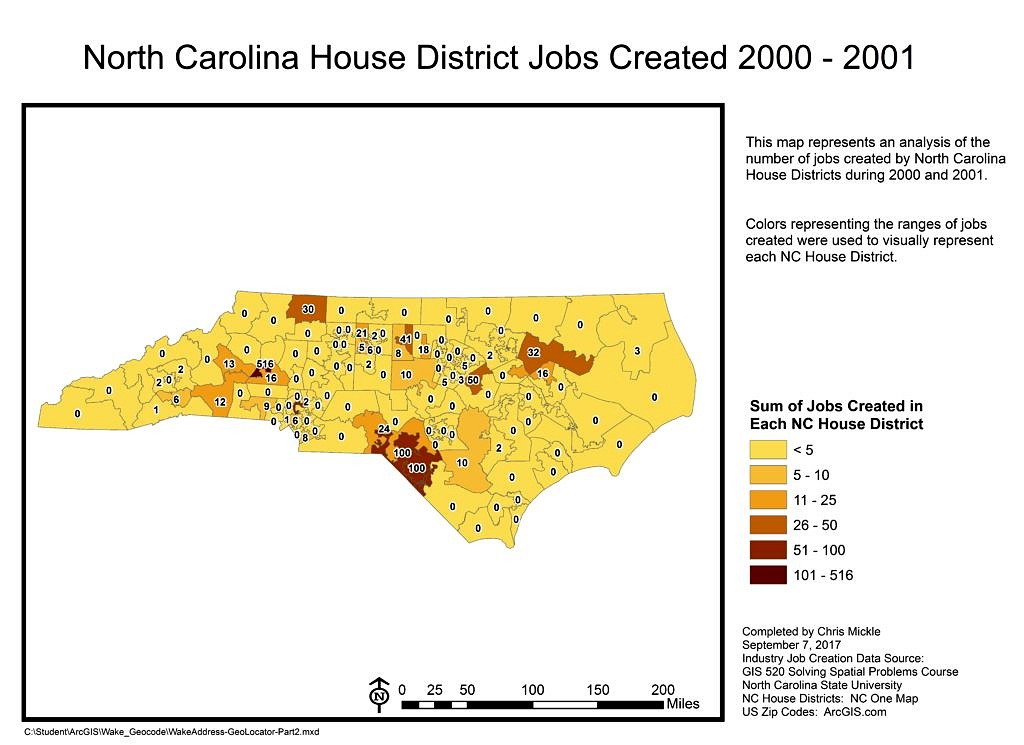
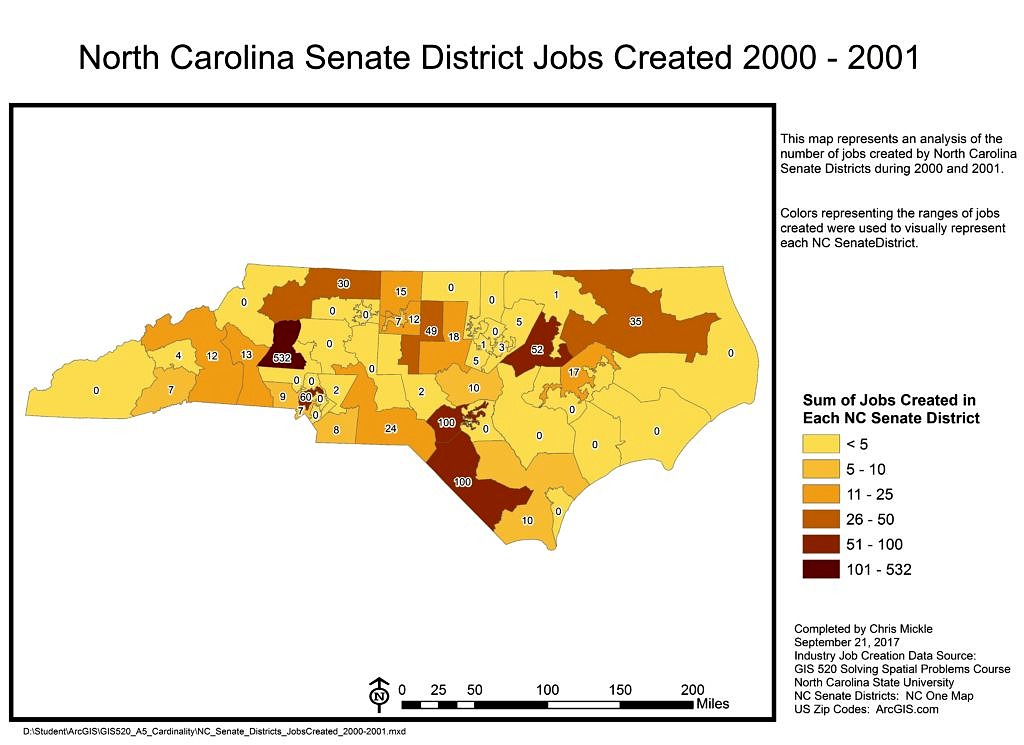
In this example an analysis of recent job creation statistics across the state of North Carolina was conducted. The analysis results needed to be visualized on a map to show the exact number of jobs created in each NC House and Senate Districts using job creation survey data from 2000 and 2001.
Analysis Procedures: In solving the example problem the Industry Job Creation survey data provided was examined using Microsoft Excel to understand what is included, identify the data types, potential key fields for linking the data and basically understand how the information could be used. Additional data acquired included publicly available GIS datsets of the latest NC House and Senate Districts boundaries from NC One Map and georeferenced zip code data from ArcGIS.com for linking business addresses to geospatial points.
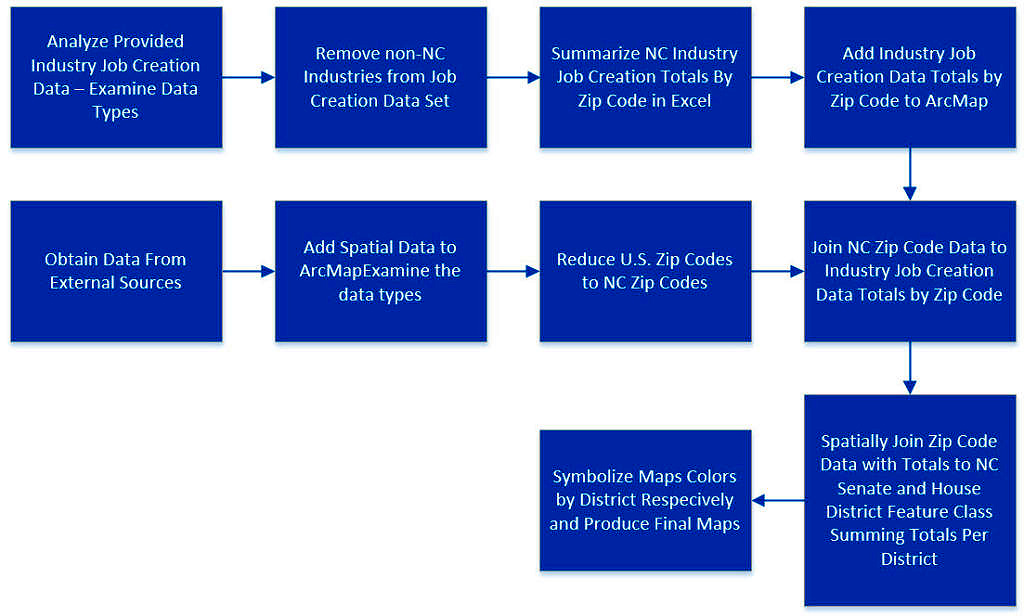
All of these data were imported into ArcMap 10.4.1. The data were aggregated to produce total numbers of jobs created by zip code during both years 2000 and 2001. Using the ArcMap Select By Attributes tool the U.S. Zip Code data was reduced to only zip codes in North Carolina. Next the Industry Job Creation totals by zip code was joined to the North Carolina zip code data using a tabular join so each zip code had a total number of jobs created during 2000 – 2001 assigned. The updated zip code data was then spatially joined to the NC House and Senate District Boundries respectively and aggregated during this process to produce one total number of jobs created per each NC House and Senate District.
Results: Two thematic maps were created showing the boundaries displaying the number of jobs created during 2000 and 2001 in each House and Senate Districts respectively.
Application & Reflection: Data Cardinality is an imperative concept to understand and implement when designing databases and datasets. It is best to have normalized data tables that do not include redundant information on every table. This allows you to update a single record for a given object in your database and that update is carried throughout the database. Implementing the concepts of Data Cardinality, normalization and data uniqueness among data tables is what makes joining and relating data tables within ArcGIS possible.
Spatially joining data, such as sums of jobs created at a zip code to a NC House or Senate District Boundary is useful to me as I often need to join locations were groundwater wells and other sampling locations are within boundaries on project sites. The aggregation of values in ArcGIS feature classes is also important to implementing summary statistics of values directly in ArcGIS to summarize these data on a